Was very interesting that I have got some data to share with you that comes from usage of Site Recovery Manager with real systems and VMs. I often get asked to provide generic guidance on vSphere Replication and usually answers are hard to quantify as they are so specific to an individual environment. Having success in a production deployment is always easier when you have information based on previous lessons, so it is a boon to be able to draw on the success of others who have gone down the same path.
When creating a disaster recovery solution using Site Recovery Manager and vSphere Replication there are a few best practices and tips that can be used to make the project a success and the transition smoother.
We’ve asked Wayne Shaw, Systems Architect, from service provider to share some real-world observations and recommendations to consider when planning your disaster recovery solution.
Wayne will share:
- Bandwidth and performance statistics of various operating system
- Formulas for calculating synchronization time
- Tips for determining RPO
Wayne Shaw, :
"Over the last few months, we’ve been testing and observing the performance of our Cloud Replication solution which utilizes VMware’s Site Recovery Manager and vSphere solution. The findings and recommendations below should give you a better idea what to expect and will help with the planning process for a successful disaster recovery solution.
Bandwidth Usage
There are two types of vSphere Replication (VR) traffic: initial synchronizations and ongoing synchronizations. Below are Hosting.com’s VR bandwidth consumption observations of and comparisons between the two types of synchronization traffic. You’ll also see our observations of VR performance for various guest operating systems.
Bandwidth consumption observations:
Bandwidth consumption observations:
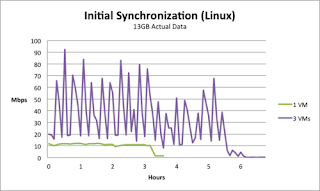
- Bandwidth consumed by VR traffic scales linearly based on the number of virtual machines (VMs) being replicated.
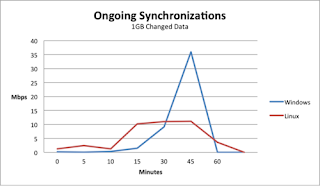
- Bandwidth consumed by VR traffic varies depending on the type of synchronization. Initial synchronizations transfer faster than ongoing synchronizations.
- Bandwidth consumed by VR traffic varies depending on the guest operating system and underlying file system with VMs.
We have observed average data transfer during initial syncs for Windows VMs at ~19 Mbps per VM when available bandwidth between sites is not a limiting factor.
We have observed the average data transfer during initial syncs for Linux VMs at ~11 Mbps per VM when available bandwidth between sites is not a limiting factor.
For ongoing synchronizations, we typically see both Windows VMs and Linux VMs transfer data at an average rate of ~6 - 9 Mbps per VM. Although, we see the transfer rates for the Windows VMs fluctuate much more than the Linux VMs.
There are several things that can affect VR synchronization transfer speeds, such as:
- The available bandwidth between sites
- Latency between the two sites
- VM guest operating system
- Load of the target VR server(s)
- The number of VR server
In the example data provided above, the link between the two sites was a 100 Mbps VPLS circuit with an average of 55 ms latency replicating to a single target VR server. The VMs consisted of Windows Server 2008 R2 and Red Hat 6 for the guest OS. The distance between the two sites was 1550 miles or 2494 kilometers.
One thing to point out is that vSphere replication statistics have been added to host and VM performance graphs in vSphere 5. These statistics are useful when trying to gauge the actual bandwidth footprint for your VR workloads and evaluating viable Recovery Point Objectives (RPO).
Synchronization Times
Below is a general formula for calculating how long it will take to transfer VM data between sites for initial or ongoing synchronization.
First, you’ll need to discover:
First, you’ll need to discover:
- Size of data to be synced
- Transfer speed for synchronization
Size of changed data (bits) / Transfer speed (bps)= Transfer Time (seconds)
In the single Linux VM initial sync example above, the actual data used on disk was 13.5GB and the average transfer speed was 11 Mbps during the initial sync.
115960000000 /11000000 = 10542 seconds (~ 3 hours)
At Hosting.com, we’ve experienced relatively consistent results for VR performance and have been able to accurately calculate the expected synchronization times for various workloads using this formula.
Recover Point Objectives
Understanding your VM workloads, actual VR transfer speeds, and per VM synchronization times is key when planning your Recover Point Objectives using VR.
In general, your calculated transfer times must be less than the desired RPO to be within tolerances. In other words, your RPO cannot be less than the time it takes to replicate the changed data per sync.
We’ve found that viable RPOs can be calculated accurately for various change rates, if the change rates are known ahead of time. We’ve also found that violations of RPOs are successfully detected and alerted upon using vCenter SRM alarms. When RPOs are violated, synchronizations continue to run until completion. vCenter SRM alarms clear when sync is back within specified RPO again.."
My sincere thanks to Wayne, and Hosting.com, for sharing their findings on replication and recovery; It's great to see what they've been accomplishing with their Cloud Replication service, and hopefully their willingness to share their real-world findings on bandwidth, sync times and RPOs can help you understand your own requirements for these items in building your own disaster recovery solutions with SRM.
Keep tracking the blog - we'll be posting another entry really soon with more information on real-world deployment practices of SRM by Hosting.com, and make sure you register for the webinar!


